Etiqueta: debug

Java Remote Debug with Eclipse

Usually when we develop an application we can replicate the environment where we are running the application to verify that the application works correctly.

Sometimes this is not possible due to some special circumstances (network, special hardware, amount of data, client restrictions,ect..) when we find an error while in this special circumstances, we need to do a remote debug.

Launch the application on the server

First we need to run the application on the server. We can generate a jar file using this instructions.

We need to launch the application with some special arguments:

java -Xdebug -Xrunjdwp:transport=dt_socket,address=1088,server=y,suspend=n -jar hello.jar

Connect Eclipse to the application to debug

To connect to the remote process we need to indicate the host where to connect and the port.

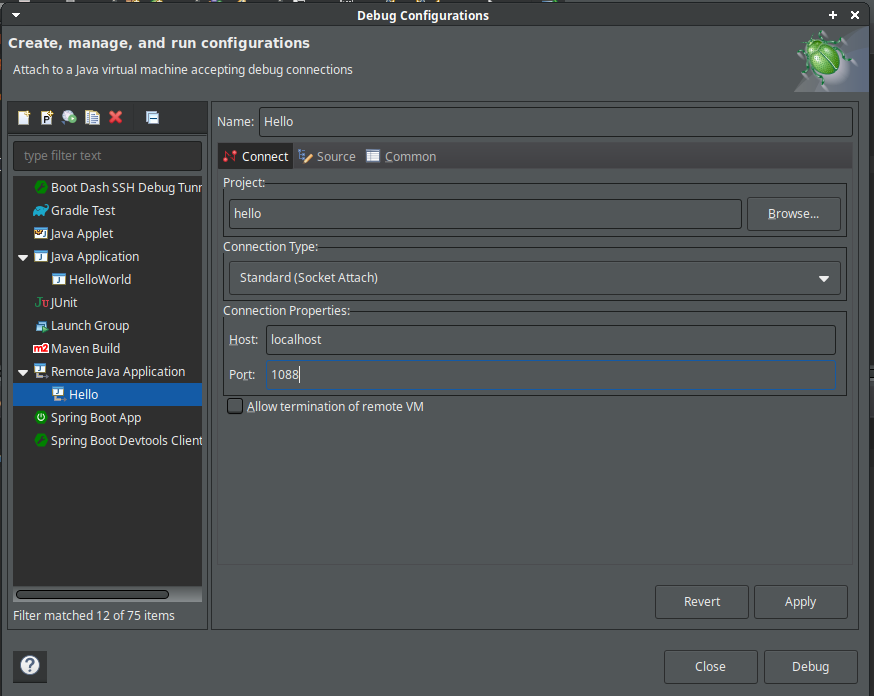
After this, you can debug the application as it was on your local machine.

If you can’t open any port of the server and you only have ssh access this article can be useful

Develop Erlang on Vscode

Erlang is a functional and concurrent programming language and fault tolerant.

Now we will see how to develop Erlang on Vscode

Install Erlang

To start programming in Erlang we need two things, the Erlang environment and rebar3 , a tool to help manage Erlang projects.

To install Erlang just run as root:

apt-get install erlang

Once we have Erlang installed we can install rebar3 :

wget https://github.com/erlang/rebar3/releases/download/3.18.0/rebar3
chmod +x rebar3
./rebar3 local install

After this, the rebar3 executable should be in $HOME/.local/bin/rebar3. Ensure that the .local/bin folder is on your PATH variable to be able to execute rebar3 from the shell.

Install Erlang extensions

Install the Erlang extension using Control+P and execute this:

ext install pgourlain.erlang

Run Erlang on vscode

If we want to run an Erlang application from vscode we need to create a launch.json like this:

{
    "name": "Launch erlang",
    "type": "erlang",
    "request": "launch",
    "cwd": "${workspaceRoot}",
    "arguments": "-s module start"
}

Debug Erlang on vscode

To debug an Erlang application we need to do a previous step. We need to complie the beam files with the +debug_info flag

To do this we need to create a task.json like this

{
    "label": "compile",
    "type": "shell",
    "command": "erlc +debug_info file1.erl file2.erl"
}

And add the preLanuchTask on the launch.json

{
    "name": "Launch erlang",
    "type": "erlang",
    "request": "launch",
    "cwd": "${workspaceRoot}",
    "arguments": "-s module start",
    "preLaunchTask": "compile"
}

Now you will be able to debug an Erlang application from vscode

Remote debug

Usually when you develop an application it will not run on the same computer where you are developing. This can caused unexpected behaviors when you deploy it,usually cause by permissions, software/package versions,configuration,ect.. or just that we write an error on our code that we didn’t notice. In those cases, it’s difficult to know what is failing but we can use remote debug to check the application state when it fails.

Tip:

If you are trying to debug a python package and the debugger doesn’t stop, try to install it with the -e flag

I use two tools in these cases:

Visual studio code remote ssh

To remote debug (and develop) with Visual Studio code you mus to install Remote ssh extenison

Once you install it, you can add a host that looks like this:

Add a new host on remote ssh.

And finally open a remote project:

Connect to a remote ssh and run a script.

After this, you can use Visual Studio code like on your own machine

PUDB

Pudb is a package to debug python applications via CLI. If you are used to and feel comfortable using CLI tools this can be a good tool to debug your python application.

To debug it with pudb you need to install the package with pip:

pip install pudb

On your code , add the following code where you want to stop:

import pudb;pu.db

Once the execution reaches the previous line, you will get a window that looks like this:

You can use the following shortcuts to interact with the pudb:

  • Ctrl+x: Go to command line or return to the code
  • n: Step to the next instruction
  • s: Step into
  • c: Continue
  • b: Toggle breakpoint

© 2024 Another dev

Tema de Anders NorenAmunt ↑